Orchards and vineyards are highly variable systems across relatively small areas: changes in slope and aspect, soil texture, shading, wind corridors, cold-air pooling in low spots, and differences driven by variety and rootstock. At the same time, intervention windows are short. A radiative frost night, a few hours of high VPD, rain followed by warmth, or a week of dry weather can quickly shift stress and disease risk.
Monitoring with agriculture sensors doesn’t replace field scouting, but it makes it smarter: it shows where to go, when to check, which blocks are under stress, and which parameters have crossed your thresholds. The goal is to move from calendar-based irrigation and generic “preventive” spraying to risk-, phenology-, and microclimate-informed decisions.
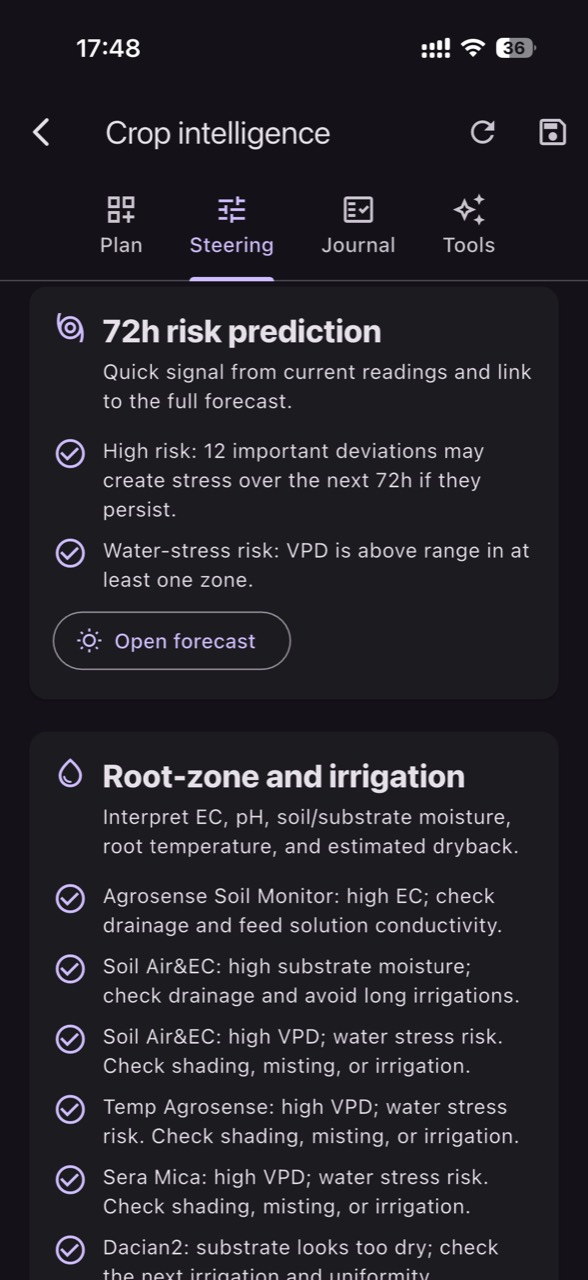
In GrowGuard you can combine live monitoring, a sensor map, weather forecast, irrigation alerts, and AI-assisted phytosanitary alerts so that measurements turn into action: start/stop irrigation, adjust application windows, prioritize blocks, and maintain traceability with reports and team access.
1) What monitoring solves in orchards and vineyards (and what it doesn’t)
Orchard monitoring and vineyard monitoring primarily solve uncertainty: you stop managing the whole farm by averages and start managing by zones and timing. In practice, that means fewer decisions based on a distant public weather station or a single weekly handheld reading.
Sensors help you notice early: temperature drops that can lead to frost, rises in air humidity that keep foliage wet, periods of high VPD that increase transpiration and water stress, or declining soil moisture in the active root zone. When you combine measurements with phenology and block history, you can adjust irrigation and plant-protection actions more consistently.
What monitoring does not solve: sensors cannot guarantee disease prevention and they cannot fully replace in-field diagnosis. They reduce the risk of missing critical windows, but final decisions should be aligned with visual scouting, traps where applicable, lab confirmation when needed, and product-label constraints.
2) What to measure: the parameters that drive risk, irrigation, and interventions
An effective sensor program starts with a short list of parameters that directly influence decisions. For orchards and vineyards, the typical core includes: air temperature, relative humidity, VPD calculation, rainfall (if you run a station), soil moisture at relevant depths, optionally soil temperature, and for fertigation or salinity-prone sites: EC and pH.
Air temperature is foundational for frost and heat stress, budbreak dynamics, growth rate, and selecting safe and effective spray windows. Relative humidity, together with temperature, describes leaf drying conditions and infection pressure for moisture-dependent diseases. VPD (vapor pressure deficit) turns those two values into a practical indicator of atmospheric demand: when VPD is high, plants transpire more and water demand rises.
Soil moisture indicates water availability in the root zone and helps you avoid both deficit (stress, reduced growth, quality impacts) and excess (root hypoxia, higher disease risk, leaching losses). EC and pH are especially useful where water/soil can accumulate salts or where nutrition needs close tracking: rising EC can signal salinity or over-concentration, while pH affects nutrient availability and fertigation efficiency.
3) Sensor placement: capturing microclimate and soil variability
Practical accuracy depends more on placement than on buying the “most expensive sensor.” In orchards and vineyards, microclimate can vary strongly between row ends, low areas where cold air settles, slopes, edges near woodland, wind corridors, and blocks with different soil types. A sound approach is to define management zones and place representative sensors in each critical zone.
For temperature and humidity, avoid placing sensors near heat sources, walls, roads, or sprinklers that can bias readings. Typically, you want a representative point within the canopy/fruiting zone, protected from direct radiation with appropriate shielding. For soil sensors, choose depths that match the active root zone: often 20–30 cm and 40–60 cm, depending on crop, rootstock, soil, and irrigation design.
In GrowGuard, the sensor map helps you see coverage at a glance: where you measure, where gaps exist, and which block is likely at highest risk. You’re not just watching values; you’re watching context: the same 25°C can mean different things if relative humidity and VPD differ between two blocks.
4) Live monitoring and alerts: turning measurements into daily decisions
Live monitoring only pays off when it leads to simple, repeatable actions. That’s why setting up irrigation alerts and risk alerts is essential. In GrowGuard you can configure thresholds for soil moisture (by depth), minimum air temperature (frost), high VPD (stress), prolonged high relative humidity (wet-canopy risk), and receive notifications when conditions exceed your set points.
A practical irrigation example: if soil moisture drops below a threshold in the 20–30 cm layer, you have a signal that the main uptake zone is drying. If the 40–60 cm layer remains wet, you may choose shorter, more frequent irrigation to avoid pushing water too deep. If both layers are trending down, you likely need a more substantial event—while checking the forecast to avoid irrigating just before meaningful rainfall.
For frost risk, thresholds on minimum temperature and rate of decline help you decide when to activate protection measures (where available) and, just as importantly, which blocks to prioritize. In cold-air pooling areas, a 1–2°C difference can completely change potential damage. Alerts reduce dependence on sporadic late-night checks.
5) Data-driven irrigation: beyond “when” — how much and how to irrigate
Irrigation alerts are a starting point; the next step is connecting data to a strategy. With drip irrigation, your goal is to keep soil moisture within a target range for the phenological stage (vegetative growth, bloom, fruit set, sizing, ripening) and your objective (yield vs quality). Sensors show dynamics: how fast moisture declines between events and how deep water moves.
A practical rule of thumb: if after an irrigation you see a clear increase in the upper layer but almost none in the lower layer, runtime may be too short to recharge deeper roots—or infiltration is limited. If the deeper layer rises steadily and stays high, you may be risking percolation and nutrient losses, especially in lighter soils. In both cases you adjust: runtime, frequency, pulsing, and you check irrigation uniformity (flow, pressure, clogging).
When you track EC and pH (in solution or a relevant soil extract), you can connect irrigation/fertigation to salinity risk. Rising EC during high evapotranspiration periods can indicate the need for a controlled leaching approach, but the decision should be aligned with water analysis, soil texture, and environmental constraints. GrowGuard helps you see trends and include them in reports for discussions with your agronomist or technical team.
6) Phytosanitary risk and interventions: using microclimate for better timing
In orchards and vineyards, many actions are timing-sensitive: preventive applications, post-rain windows, treatments before/after risk events, and decisions about where to scout. Local microclimate (temperature, humidity, duration of wet periods) influences infection pressure and development speed for several pathogens. Monitoring helps you understand when a risk event was likely, not just when you had time to visit the block.
GrowGuard can provide AI-assisted phytosanitary alerts based on measured conditions and forecast to highlight periods when risk is rising and a field check or a treatment decision (aligned with your program) may be warranted. Importantly, these alerts are decision support, not a replacement for local guidance, labels, and visual evaluation.
A practical application: after rain followed by moderate temperatures and high humidity, the system can flag an elevated-risk window. The manager can prioritize scouting in blocks with a known history, where the sensor map shows the longest high-humidity periods. This makes interventions more targeted and helps the team use time efficiently.
7) AI Plant ID and guided scouting: less searching, more confirmation
Even with sensors, you will still scout. The difference is that you go out with a short hypothesis list: water stress in a block, disease risk in a persistently humid zone, or a potential irrigation-uniformity issue. In that context, GrowGuard’s AI Plant ID can help teams quickly identify a plant, an ornamental species near the operation, or in some cases clarify common symptom confusions (for example, sunburn versus nutrient-related visual symptoms).
The practical value is standardization: when multiple people scout, notes are often inconsistent. With an identification and observation flow attached to the alert context, communication improves between operators, technicians, and managers. For critical decisions (especially disease), agronomic expertise and confirmation remain recommended.
The combination of alerts (what the risk suggests), the map (where the risk is), and guided scouting (what you actually see) is one of the fastest ways to convert data into consistent interventions.
8) Connectivity and integration: LoRaWAN, NB-IoT, MQTT, and TTN API imports
In the field, infrastructure determines feasibility. For orchards and vineyards, LoRaWAN is often chosen for low power and strong coverage—especially if you can install a gateway. NB-IoT can be a strong alternative where suitable cellular coverage exists and you want faster deployment without your own infrastructure. What matters is stability and visibility into signal quality and device autonomy.
GrowGuard supports mixed scenarios and integration, including MQTT-based flows and TTN API imports, allowing distributors and farms with existing ecosystems to centralize data. In practice, that means fewer data silos and a shared view across irrigation, risk, and operations.
Regardless of the technology, track battery and sensor status in the platform. A good alert isn’t helpful if the sensor ran out of battery during the exact week risk peaked. Device health monitoring should be treated as an operational task—just like checking irrigation filters.
9) Reports, traceability, and team access: operating at scale
For owners and managers, value shows up when data becomes repeatable: weekly summaries, block comparisons, risk-event logs, and documentation that supports decisions. GrowGuard reports help you explain why you irrigated more in one block, why you changed a spray window, or why you prioritized a team in a certain area on a certain day.
Team access matters in modern horticulture: operators see irrigation alerts, technicians see trends and sensor status, managers see the bigger picture and block-to-block comparisons. When everyone works from the same dataset, communication errors drop and the likelihood of timely actions improves.
For distributors, standardization is a commercial advantage: you can deliver a clear package (sensors, connectivity, thresholds, reports) with a shared language. That reduces support time and increases adoption, without making unrealistic promises.
10) A simple 30-day implementation plan
Days 1–3: define objectives. Do you primarily want irrigation alerts? Frost-risk control? Visibility into air humidity and VPD? Identify 3–5 decisions you want to improve and the parameters that support them.
Week 1: define management zones and choose locations. Install sensors in blocks with high variability or known issues. Enable live monitoring and confirm on the map that positioning is correct.
Week 2: set thresholds and irrigation/risk alerts. Adjust thresholds after the first observations (for example, soil-to-soil differences). Make sure alerts reach the right people and assign an action owner for each alert type (irrigation, frost, sensor status).
Conclusion
Orchard and vineyard monitoring becomes truly valuable when it is tied to decisions: when to irrigate, how much to irrigate, where to scout, when risk is rising, and how to prioritize interventions. GrowGuard brings together live monitoring, a sensor map, forecasts, irrigation alerts, and AI-assisted phytosanitary alerts, plus tools like AI Plant ID, reports, and team access—so data is practical for daily operations.
Start with essential parameters (temperature, humidity, VPD, soil moisture; then EC and pH where relevant), place sensors by zones, track trends and battery status, and turn every alert into a clear check-and-act routine. It’s not a “guaranteed outcome” recipe, but it is a practical method to reduce surprises and manage risk more consistently in unpredictable seasons.