Drift or network? How to quickly tell a real crop issue from a connectivity problem (LoRaWAN/NB-IoT/MQTT) in GrowGuard
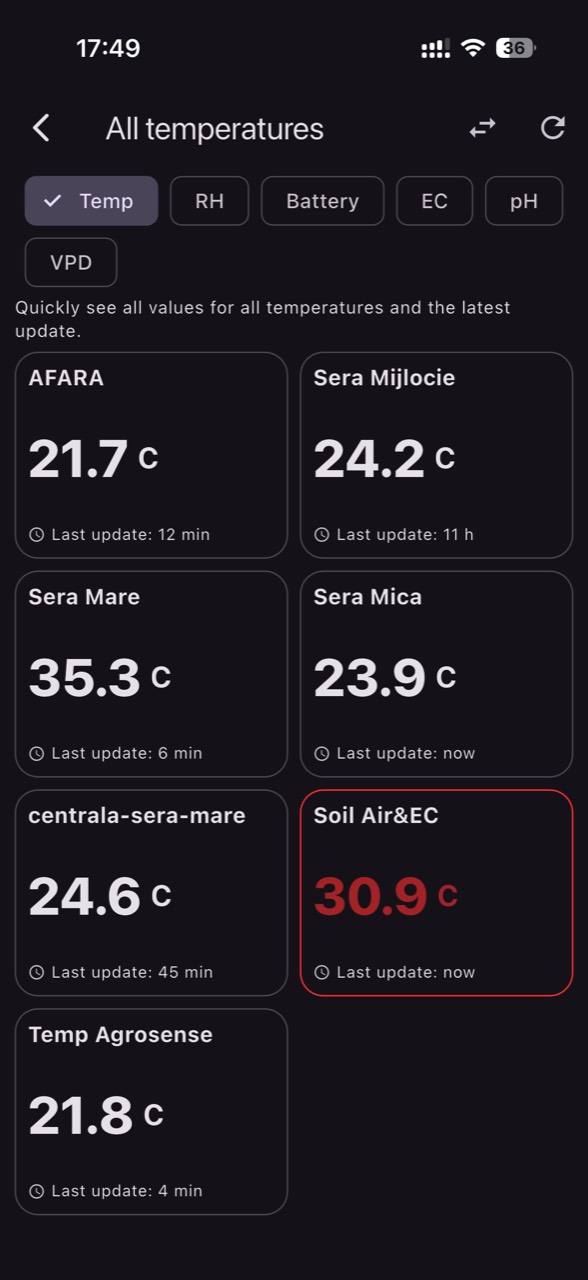
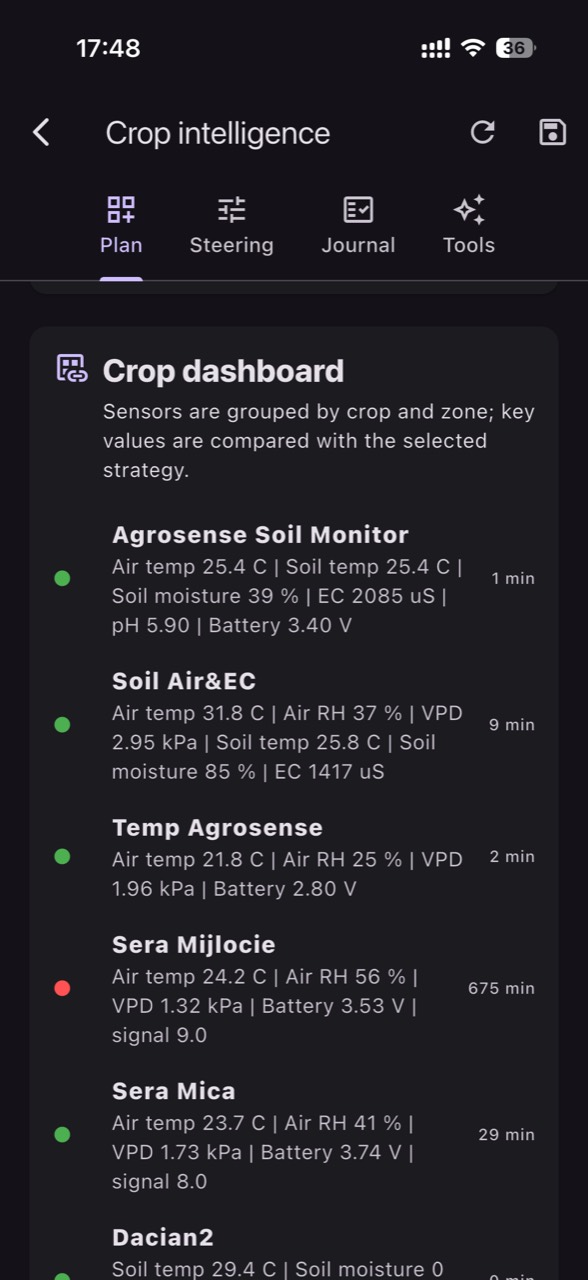
When readings jump or get stuck, the right decision depends on a fast diagnosis: is it a real crop change or a network/sensor problem? This guide shows how to use status alerts, battery level, reporting intervals, and zone history in GrowGuard to react faster and take the right actions.
Read article